Cohort analysis - Adobe Analytics/ Report Builder

1) First off we'll create an eVar for storing the download date - which we've called "First touch download date", we're storing the date in YYYY-MM-DD format (this is an Excel friendly format too). Allocation should be first touch (means it won't be overwritten), and we've set the expiry to 90 days. Adding classification might make things easier for you, so this should be a consideration - for example; week number, month.

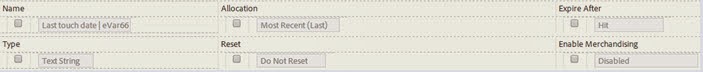
2) Now that we have an eVar for storing when the download occurred we need another for comparing when the order happened, we use the same format as before; YYYY-MM-DD and we're calling this "Last touch date". This is simply the current date and will be attributed to the order or any other event we want for future cohort analysis.
3) Next we're going to build a segment, this won't always be required but I suspect it'll be a common requirement when building cohorts. So for this example I want a segment that only displays a particular downloaded product ("Acme software") and only visitors that have completed an order - this will really refine our data request. Our segment uses a Visitor container with our downloaded product and sequential order event.

4) Now to Report Builder - apply our segment, dates and apply aggregated granularity:

5) Next add our 1st dimension 'First touch download date'.

6) Click "next" and add our 2nd dimension 'Last touch date' and add the order metric. Our preview now looks like this:

7) Run the request and our Excel output looks like this:

8) We now add a 'days difference' column which is a simple subtraction of order and download date which will return an integer. Our excel sheet now looks like this:

9) The final part is to create a pivot table based on the 'Orders' and 'Days difference' column:

And Voila! With this data we can now create line charts that tell us when we receive orders based on the download date cohort:


